
Background
This project is the final project from the course 509000 Business analytics using data mining, offered by professor Galit Shmueli from Institute of Service Science, NTHU.
Collaborating with a zero waste shop nickname Little Green Shop, this project aims to utilize its POS data for increasing profit or encouraging customers taking more sustainable behaviours. To focus on the data analysis rather than programming details, the analysis in this project is requested to be done by Rapidminer, a data mining software taught in the class.
Goal
Revised with the shop owner, this project is expected to meet the following goals,
- Business Goal: Increasing in-store sales
- Environmental Goal: Making sustainable purchases, such as avoiding unnecessary packaging by encouraging customers to bring their own containers when shopping.
In addition, as a course project, it is expected to utilize machine learning methods taught in the class, ranging from CART (Classification And Regression Tree), Logistic Regression, Clustering, Association Rules, and others.
Process
Data Preparation
Data clean and transformation is applied first to the given POS data as follows,
- Data clean: Removing non-used columns
- Data transformation:
- Derived datetime variables from purchase date and time, such as
Month,Season,Weekday, orPeriod. - One hot encoding
Purchased Itemfield to columns. - Derived
Categoryfield by grouping 322 purchased items to eleven categories, such as Grain, Snack, or Tea.
- Derived datetime variables from purchase date and time, such as
Data Mining
To meet the goals above, the derived machine learning goals are as follows,
- For increasing in-store sales, we would like to explore potential product combinations strategies.
- For making sustainable purchases, the relationship between products and if the customers bring their own container would be studied, called as container analysis.
The product combinations are explored by Association Rule, which are expected to discover implicit buying pattern between different products, while container analysis elaborating CART and Logistic Regression to learn the relationship between products and bring container.
Result
Four Product Combinations are discovered by Association Rule
Analyzed by Association Rule, four product combinations are extracted. For the transactions with container, three combinations are named as Spice together, Dried fruit on March, and Noodle together, while there is only one combinations called as Spice on December extracted from the transactions without container.
The figure 1 shows a summary for the analysis process by the Rapidminer and the results of the analysis. The low Support of all combinations are assumed to be caused by the relatively low ratio of the transactions of target products over the whole transactions set, which contains around three hundreds products.
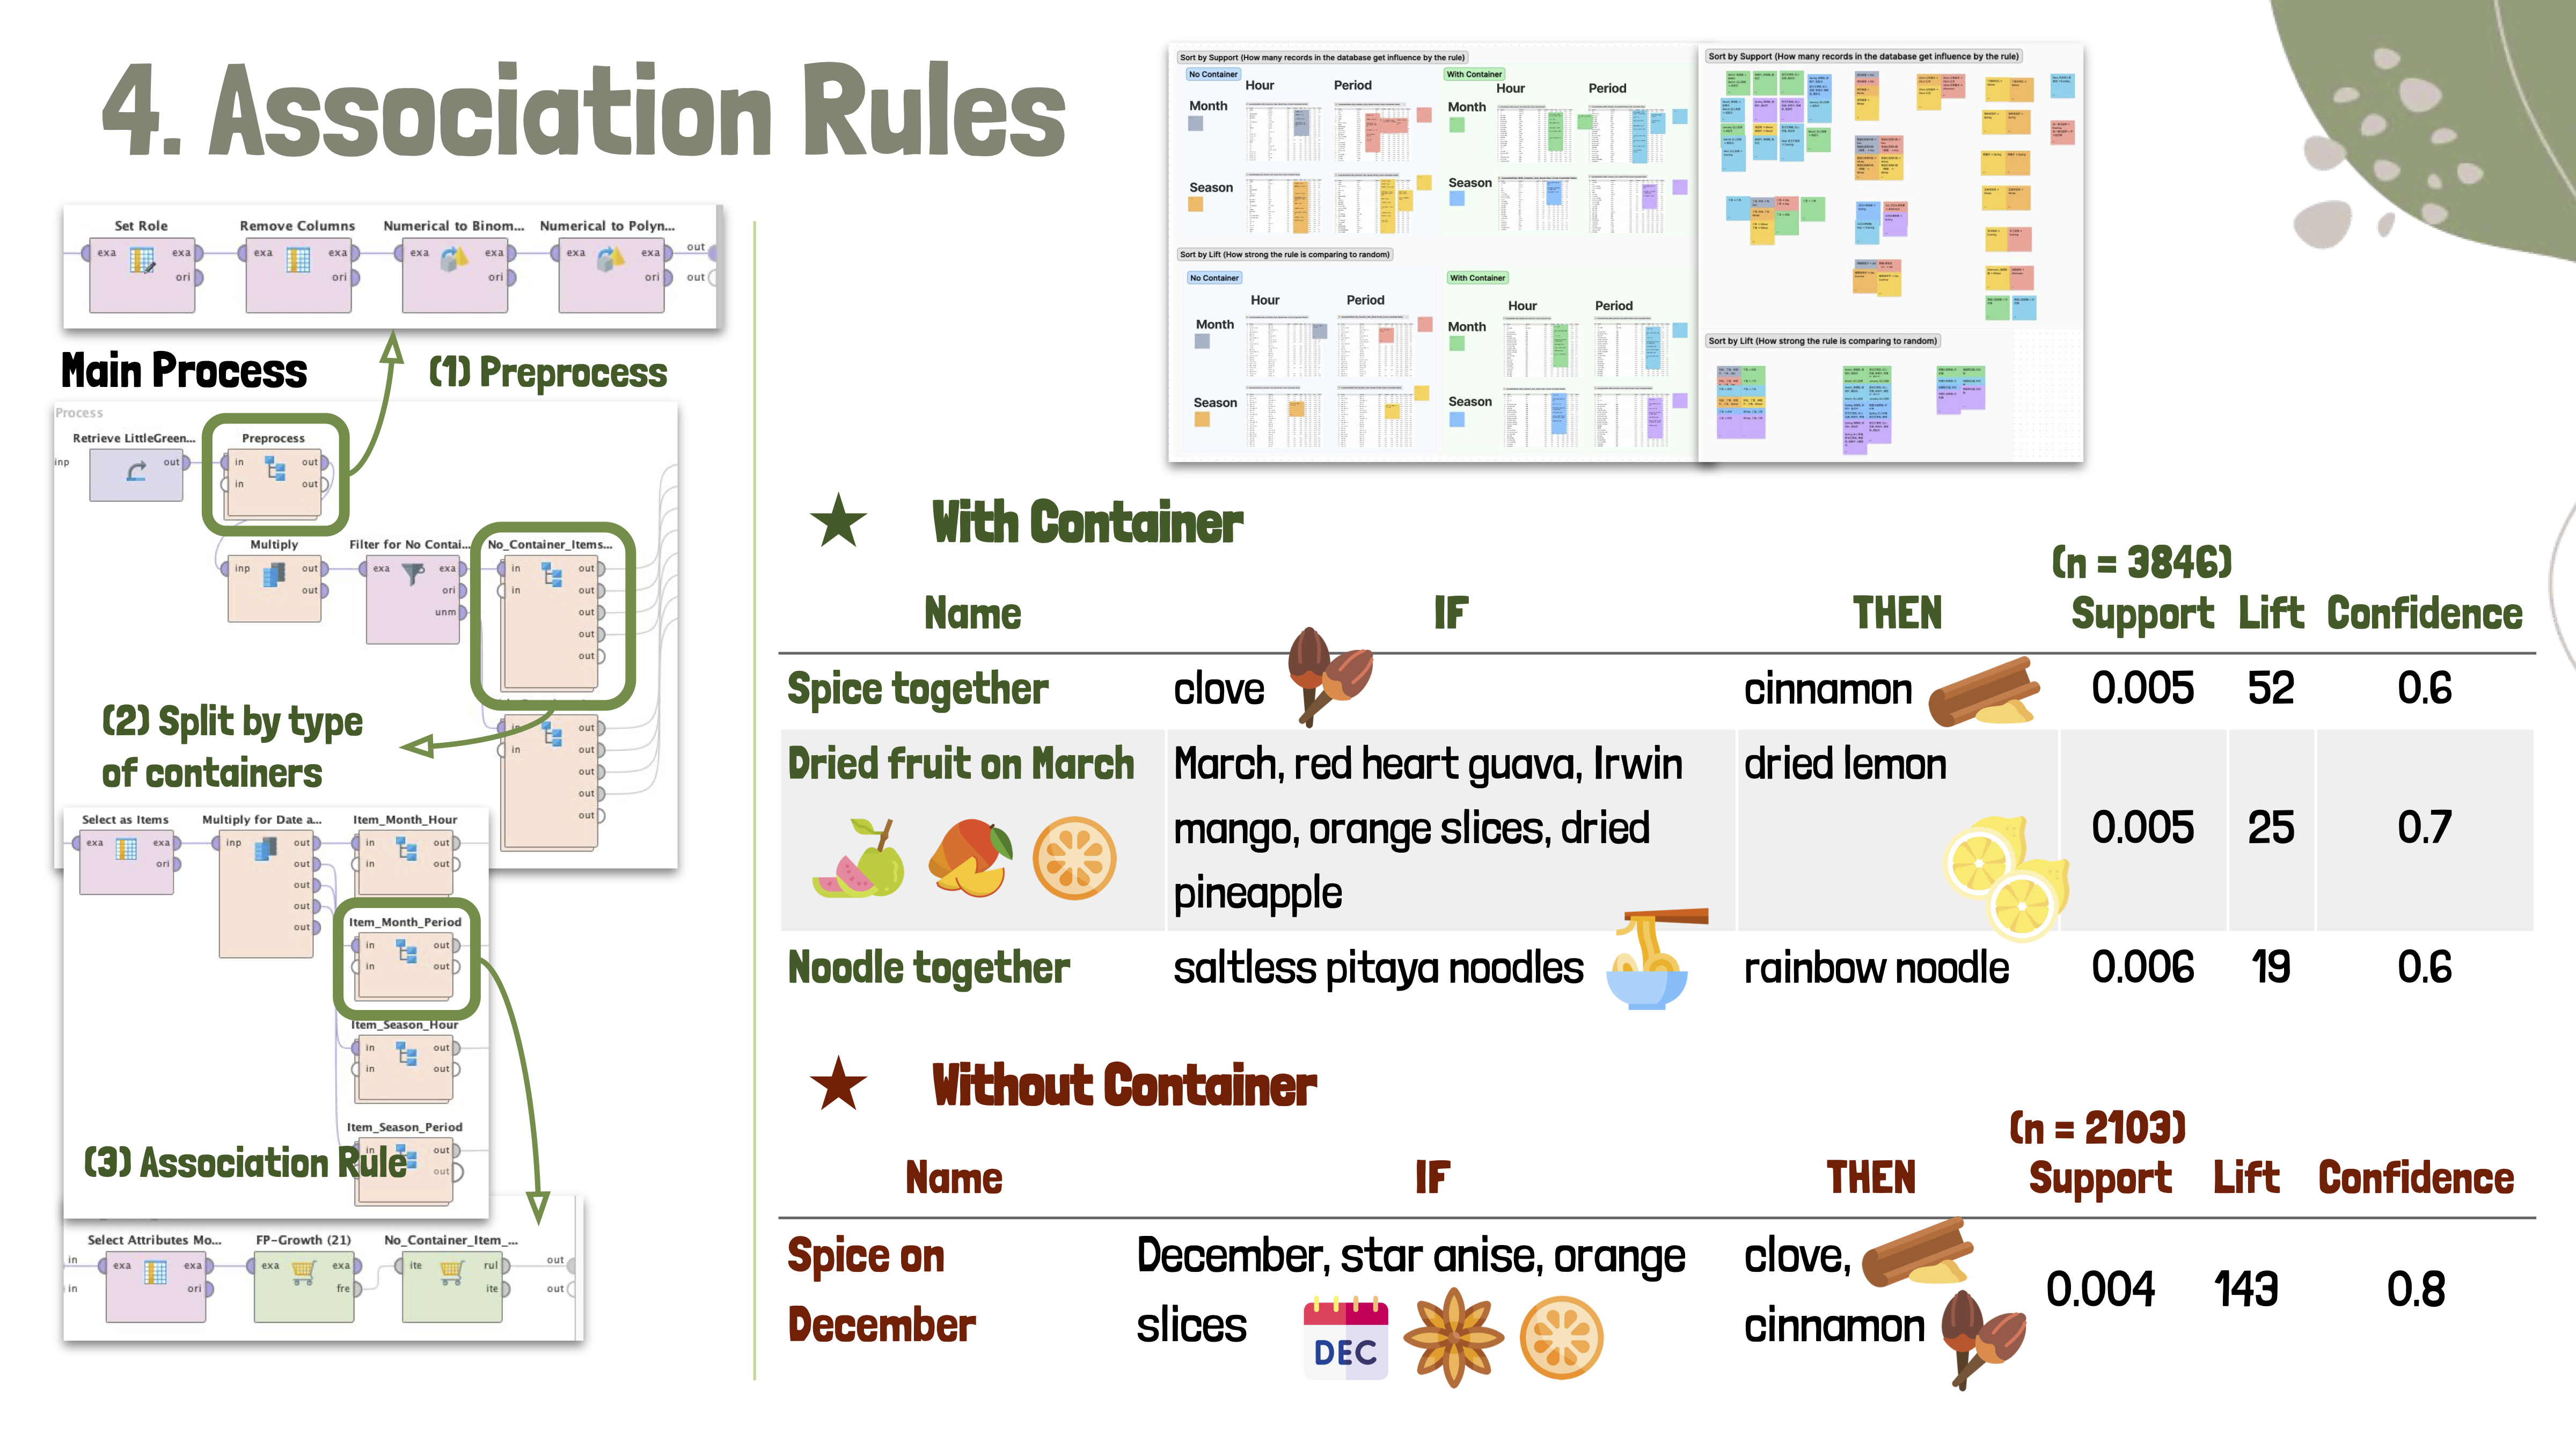
Figure 1: Association Rule Analysis Results
Vaguely descriptive pattern are extracted from the Container Analysis
The CART shows a few of products could vaguely indicates if the customers would bring their own containers. The figure 2 shows the selected products with different seasons. Since in general customers tend to bring containers (65% of the transactions are with containers), it is interesting that for whom not buying Red Heart Guava and Airplane Cracker will tend not to bring their own containers, which are opposite to the general tendency.
In addition, while people who buying egg, facial cleanser, dish detergent or nuts would much more often to bring containers, the finding is limited to the small ratio of the transactions.
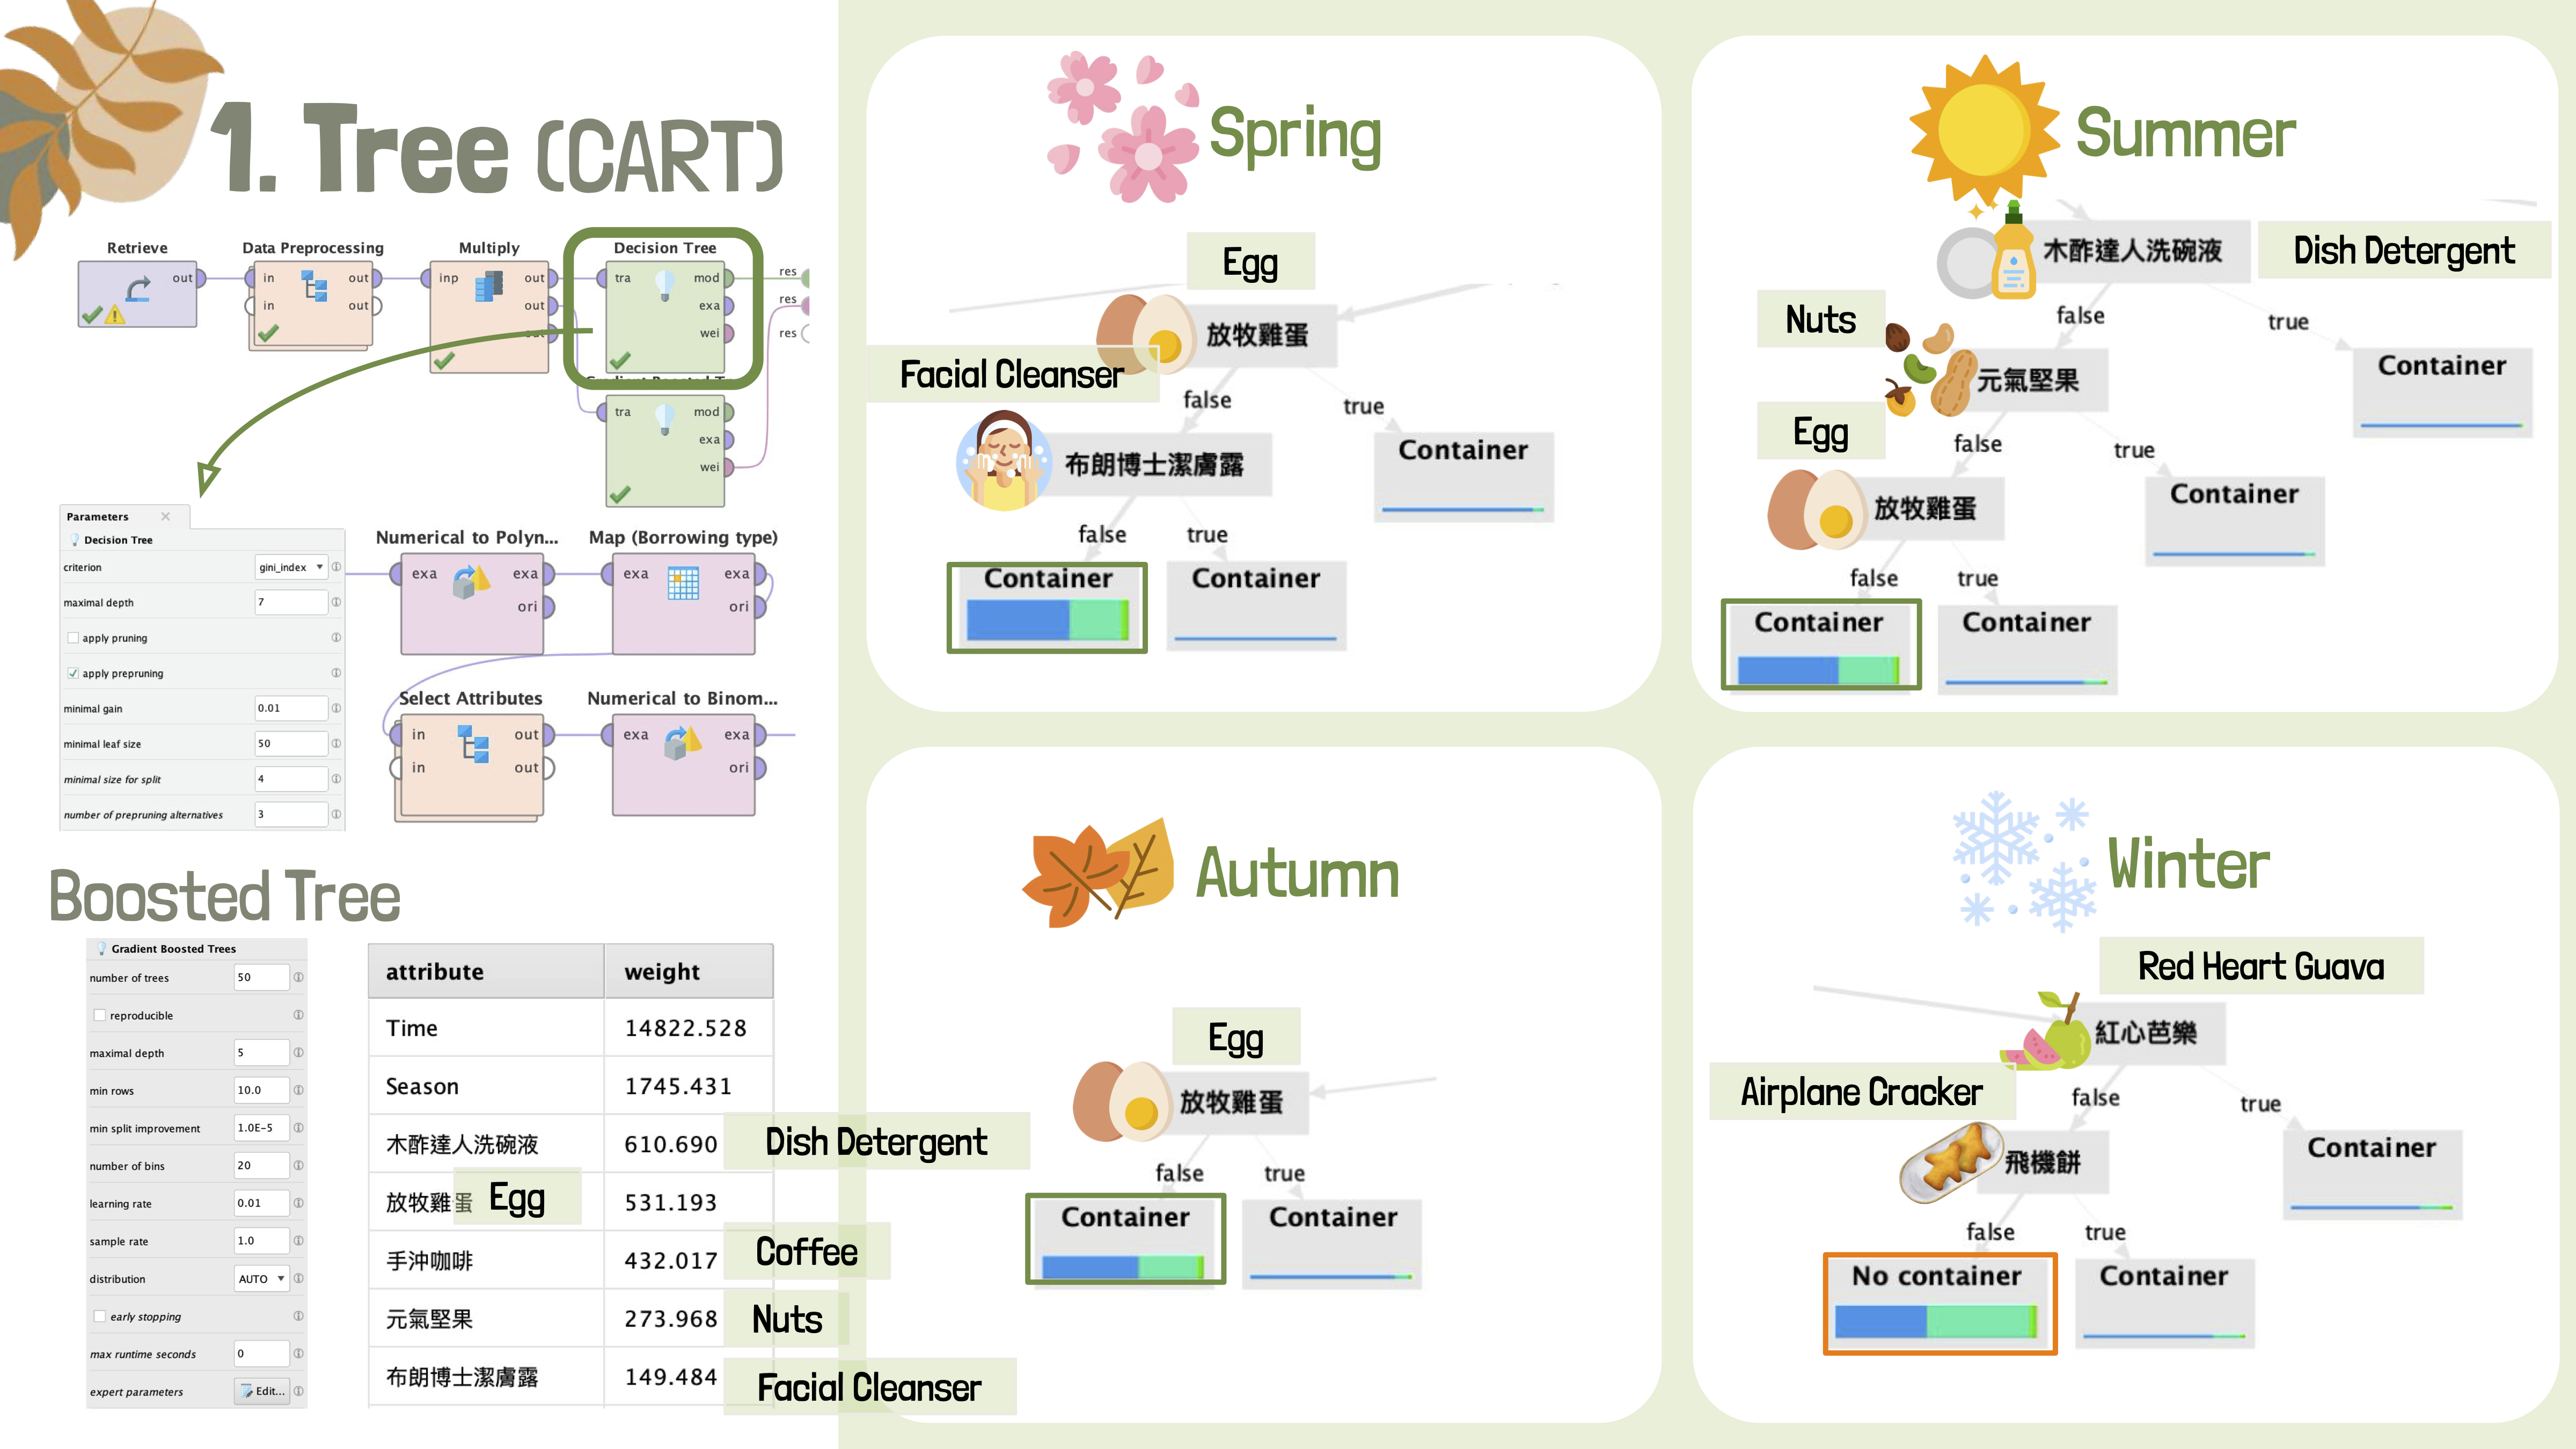
Figure 2: CART Analysis Results
To focus on a few of products which would be more related to container, the Lasso Logistic Regression is used to select variables. The results shows as follows,
- With container: Detergent, eggs, rice, vegetable, nuts, airplane crackers
- Without container:
- Datetime variables: Winter, Friday, morning
- Products: Coffee, Sanitary Napkin, Eco-friendly Cup
It matches the finding from the CART that if people buy detergent, eggs, or nuts, they will more likely to bring their own containers. In addition, it seems like people tend not to bring containers in Winter.
My Role
Most of the works are done mutually in our team. Important decisions, such as setting machine learning goals or selecting machine methods are made through discussion. Data preparation are mainly done with Python script, programming mutually on Google Colab.
At the Data Mining part, each selected machine learning method is assigned to different member. I get assigned to the Association Rule, including applying Association Rule through RapidMiner, summarizing and explaining the result, and prepare for corresponding slides.
I also get assigned to deliver half of the presentation. The presentation is recorded as the following youtube video. (Start from 53:40)
Takeaway
There are three main takeaway from this project,
1. The emerging nature of data cleaning and transformation process
It required well understanding about the dataset to perform data preparation and follow-up data analysis. Except default cleaning process like checking empty/duplicate values or non-used columns, other non-trivial processes emerged when we went through the data, such as grouping products to categories for better overall understanding, one-hot encoding products to transform the categorical variable for analysis, or extracting datetime variables from Purchased Date and Purchased Time to include datetime attributed to the data analysis.
2. Obvious machine learning goal might not lead to sense-making result
While both the business and environmental goal are obvious, it is challenged to define a sense-making machine learning goals.
For example, it is intuitive to apply supervised learning methods since “learning from the data, and predicting with the new input” sounds powerful, and also quite common when mentioning about machine learning or data mining. Price, as an numeric variable which so common to be used as the target for training, was selected. Though we were so eager to apply supervised learning by using transaction columns (such as datetime variables or Product field), it soon shows that the result would be “predicting price based on what customer buy at which time”, which would be totally meaningless as price is always calculated by what they buy!
In addition, on-time model might not be practical as this is a shop weather then online services, so there might be lag between data input and responding. Thus, we finally chose product combination and container analysis. (generating rules for shops, no need to have on-time input)
3. There are always results from data mining, where challenges come are the explanation
For example, at first when we get the result from CART, it looks inspiring as the analysis do pick variables. (ex. egg, facial cleanser, dish detergent) Only when we examine the result, it shows that the majority of the records are for people who NOT bought these product, and while they seems to prefer bringing container, the ratio is actually quite similar to the overall ration. Thus, similar results could be attained if we just check buying which products would be strongly related to bring containers.